
Category Profitability
The Category Profitability report shows various metrics grouped by category, such as revenue, fee, refund, and profit.
To navigate to this page, click Analytics from the left menu. Then, select Profit by Category.

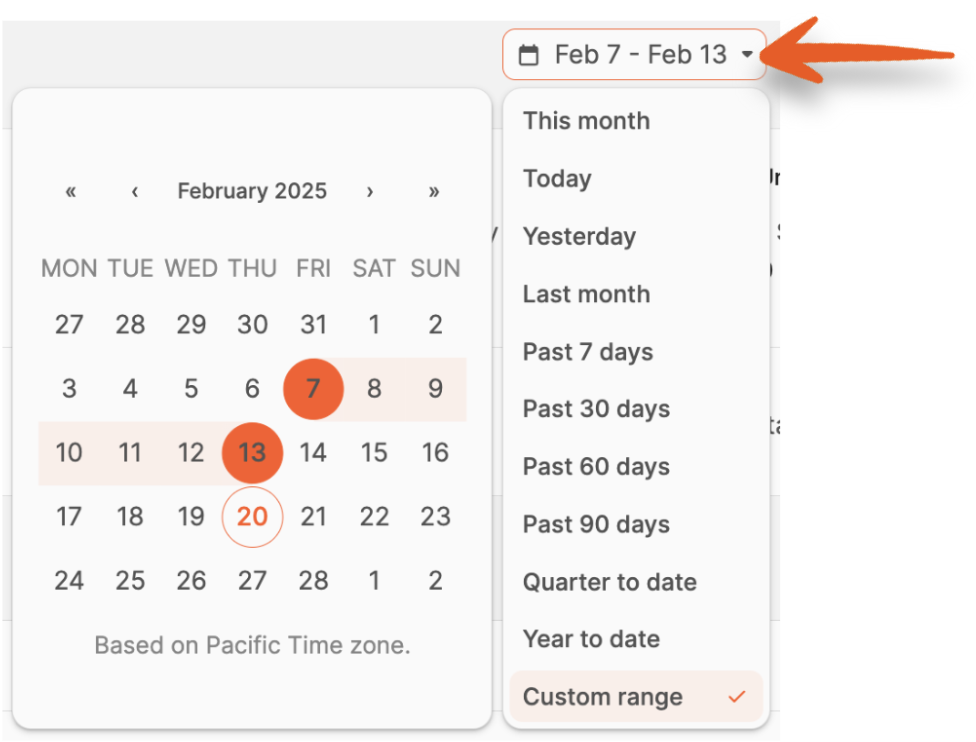
Click the dropdown menu to choose a date range for which you'd like to review data or set a custom range.
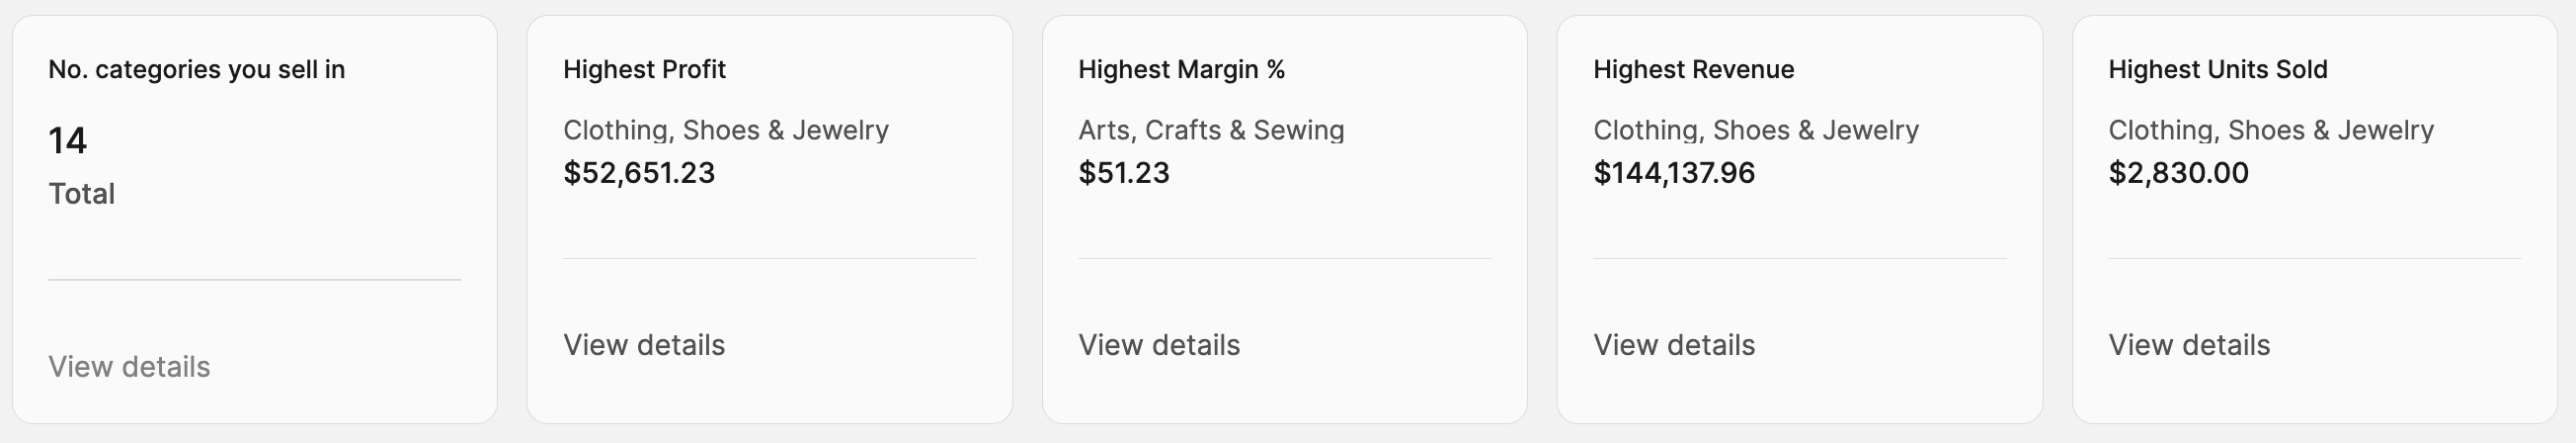
The Number of categories you sell in is displayed along with cards showing categories that meet the following criteria for the date range being viewed:
- Highest Profit
- Highest Margin %
- Highest Revenue
- Highest Units Sold
Clicking View Details will show various chart breakdowns for the category, such as daily revenue, fee, refund, total profit, and a list of the products sold.
View Details
The category name will display, and clicking the arrow will take you back to the report.

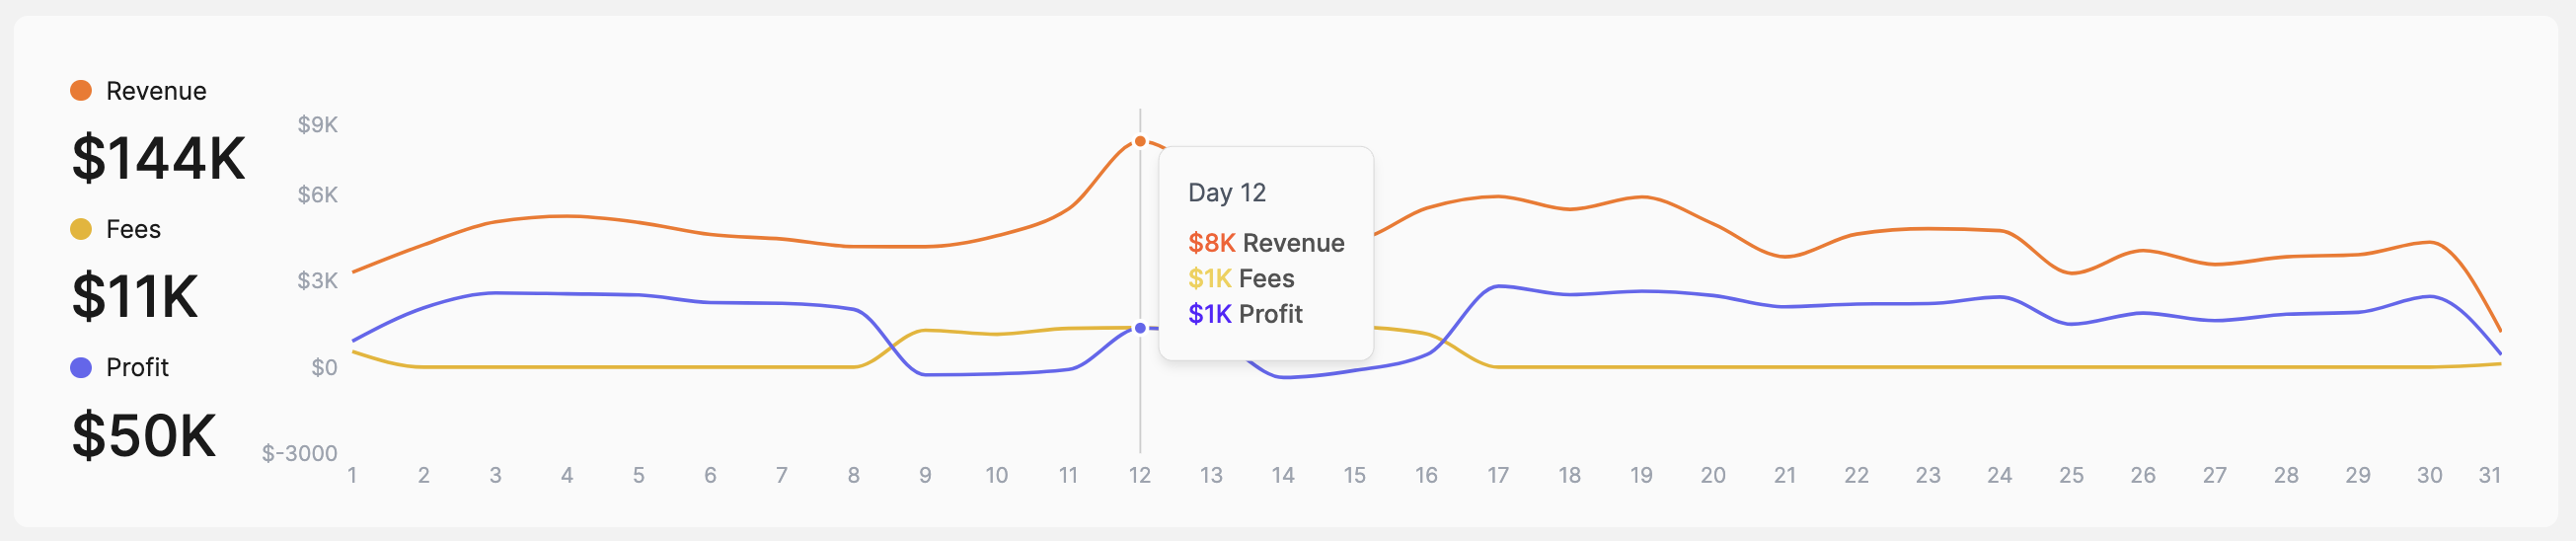
The first graph shows trends for the category based on the timeframe being viewed. Hover over each day to see the Revenue, Fees, Units sold and Profit.
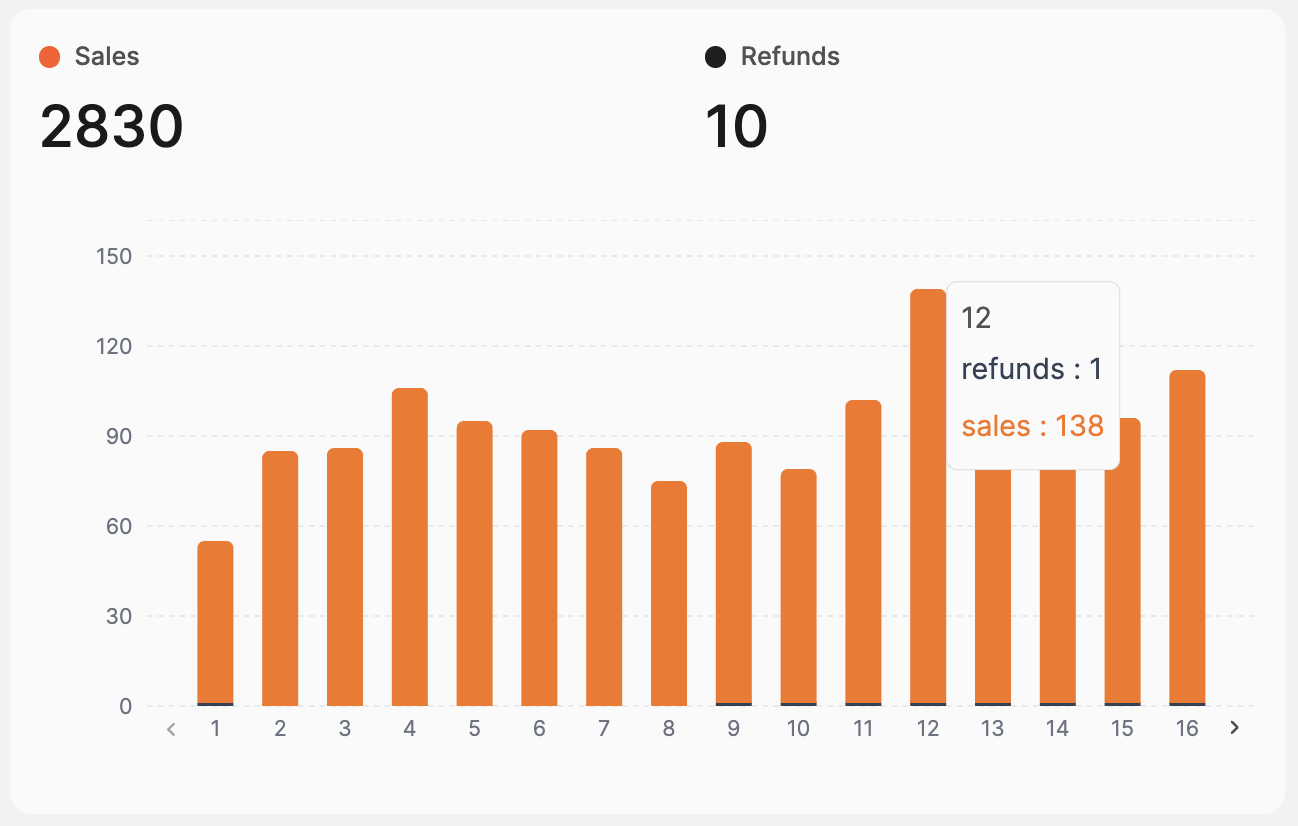
The next graph shows sales and refund data. Click the arrows to show additional days in the timeframe being viewed if available.
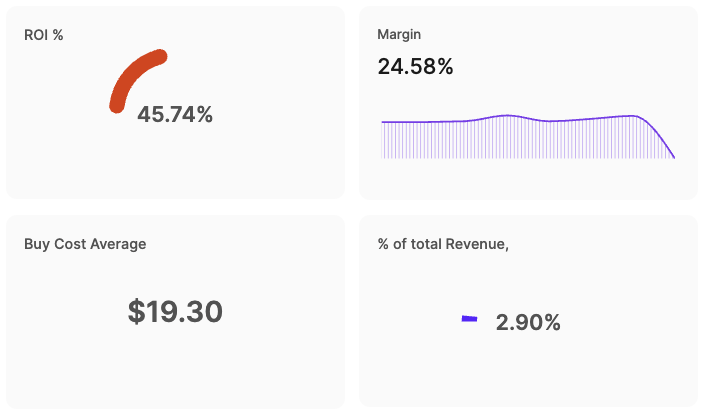
There are also visual representations for ROI%, Margin, Buy Cost Average, and Revenue.
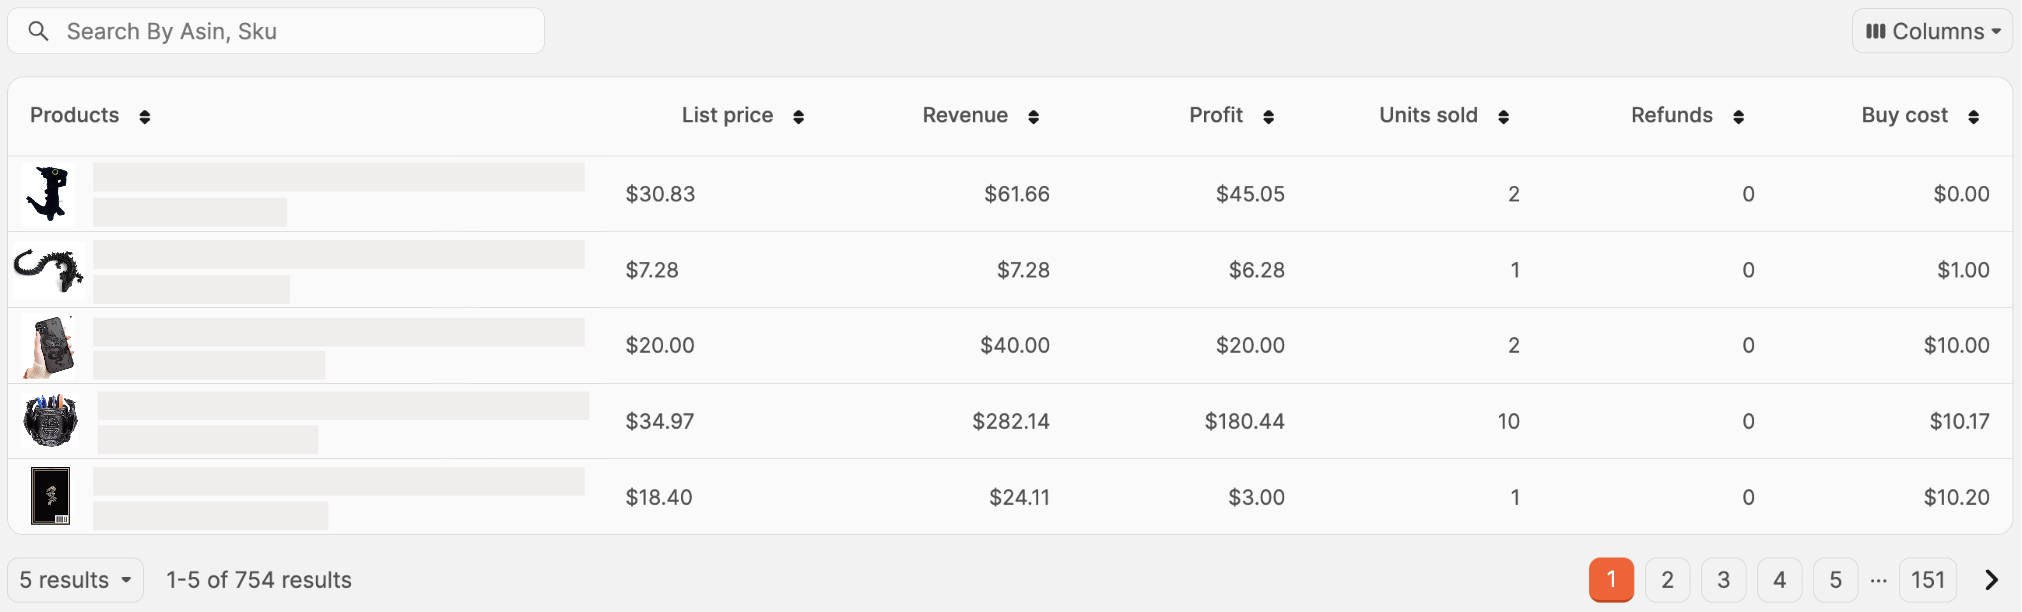
At the bottom of the page, a list of products sold in the category during the selected date range is displayed.
You can use the search bar to find products by SKU or ASIN.
Choose the data shown by clicking the Columns button, then click the checkboxes next to the columns you'd like to see.
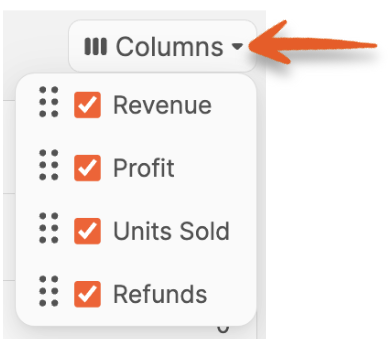
The available columns are:
- Revenue
- Profit
- Units Sold
- Refunds
If you want to change the order of the columns chosen, click and drag the option up or down to the desired position.

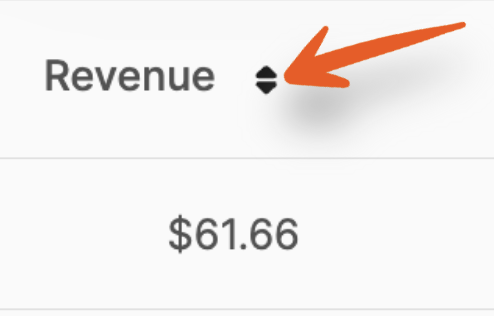
All columns are sortable by clicking the arrows next to them.
Category Table
At the bottom of the main report page, a list of categories for products sold in the selected date range is displayed.
You can use the search bar to find products by Category.
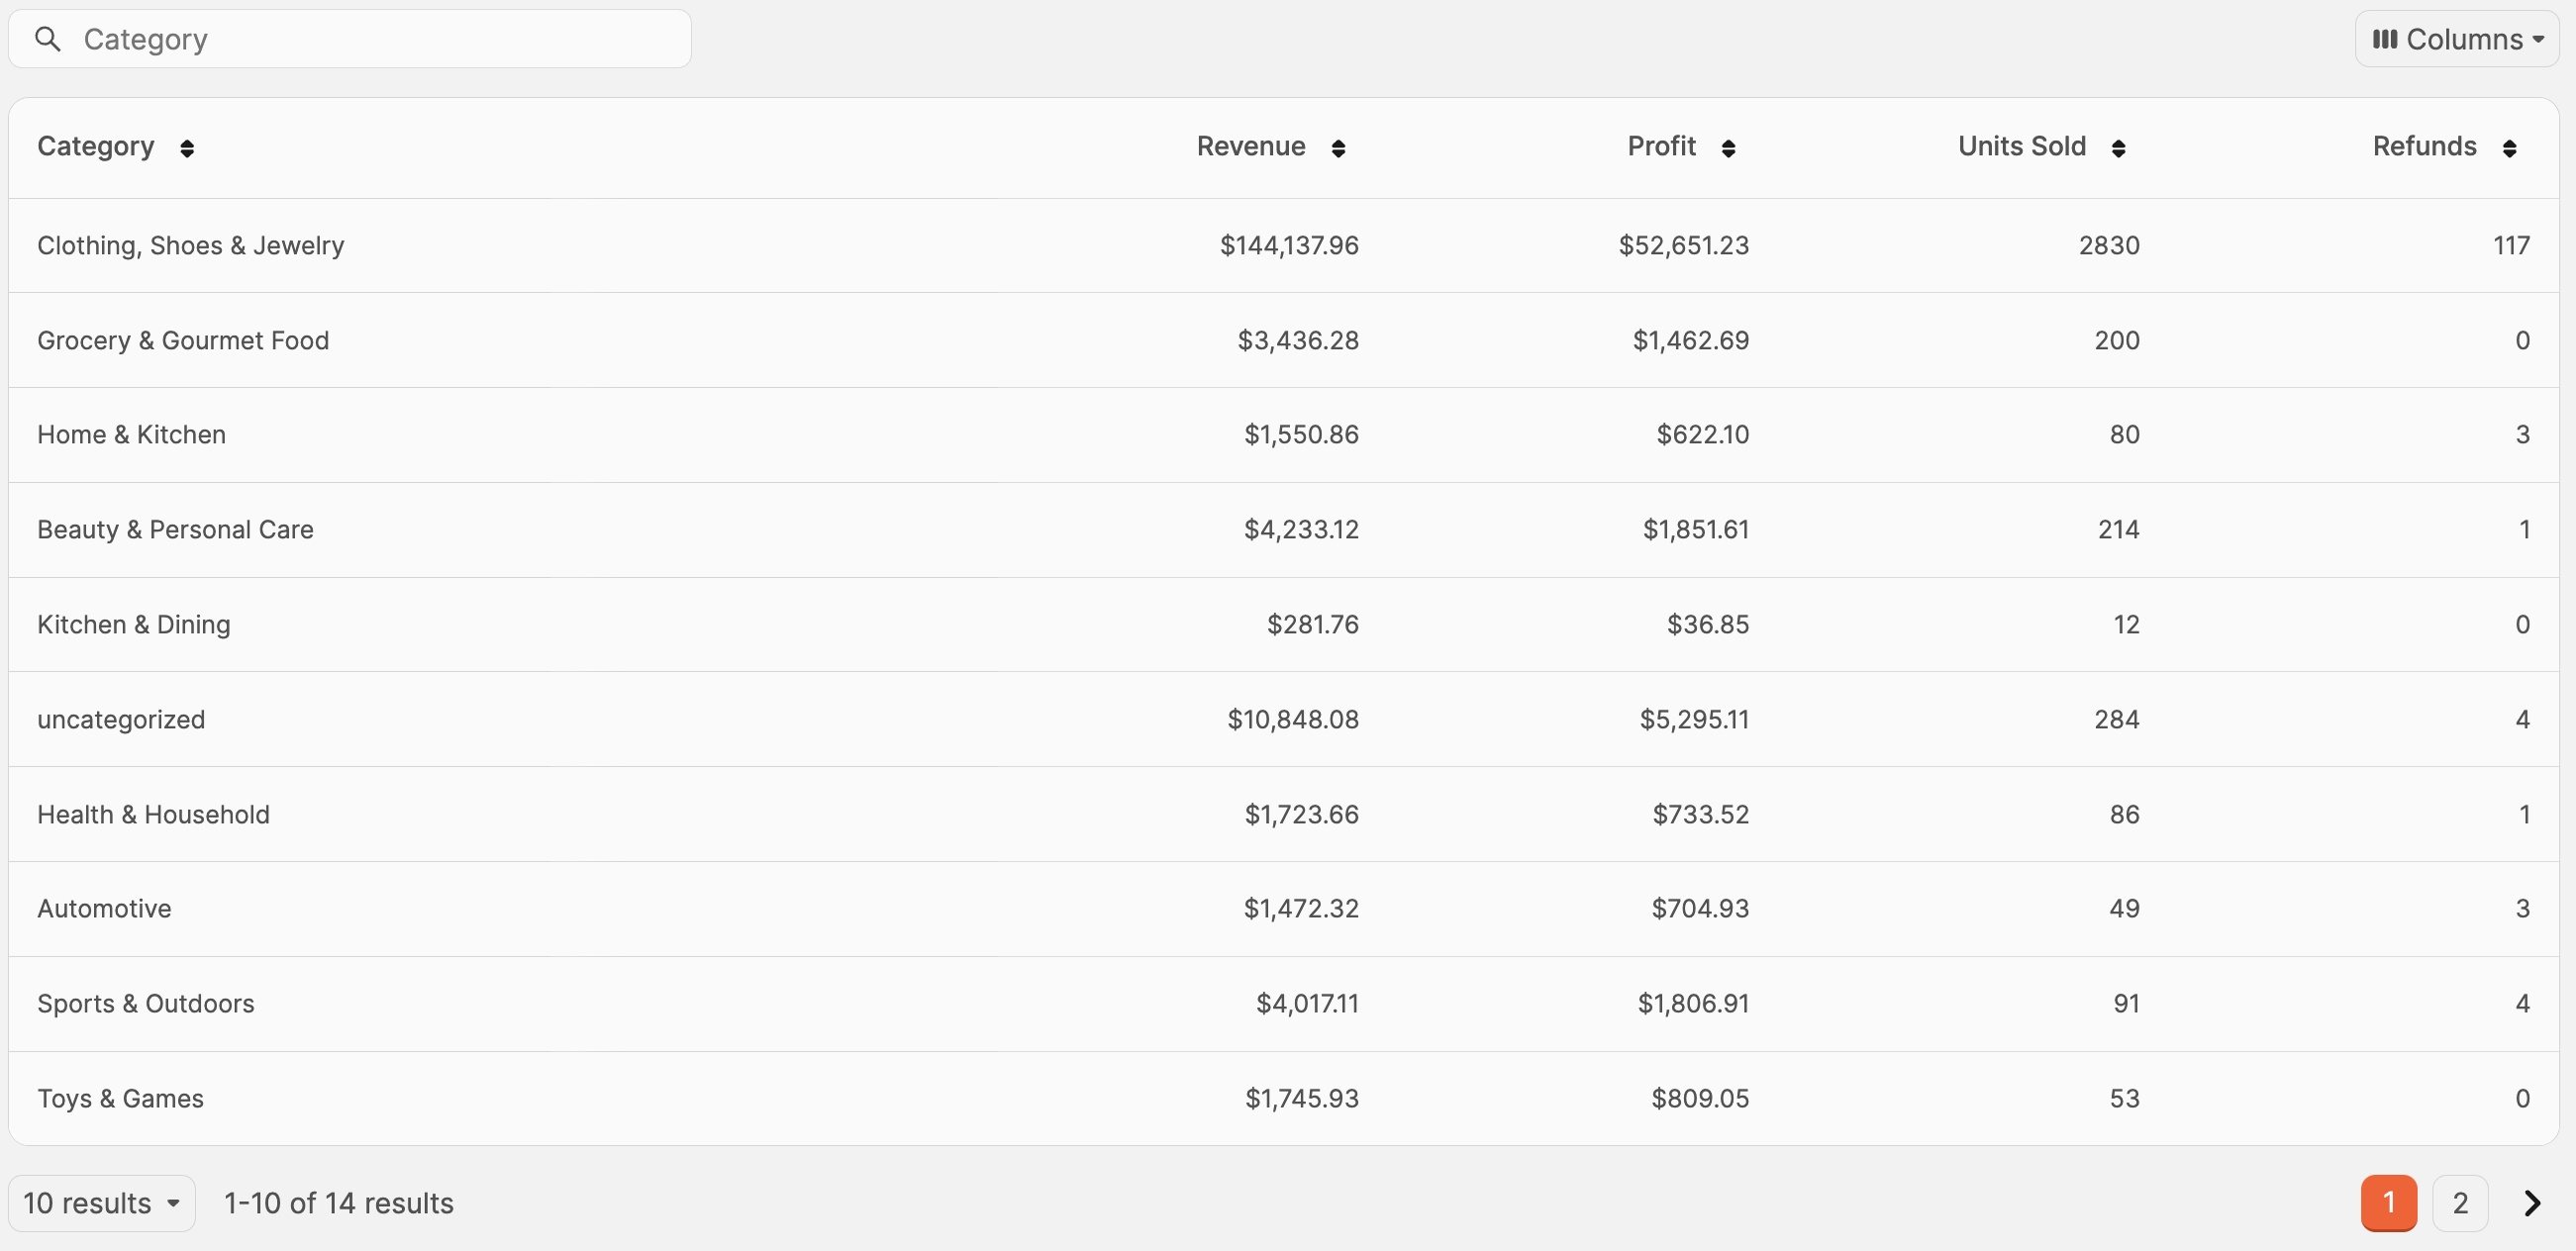
Choose the data shown by clicking the Columns button, then click the checkboxes next to the columns you'd like to see.
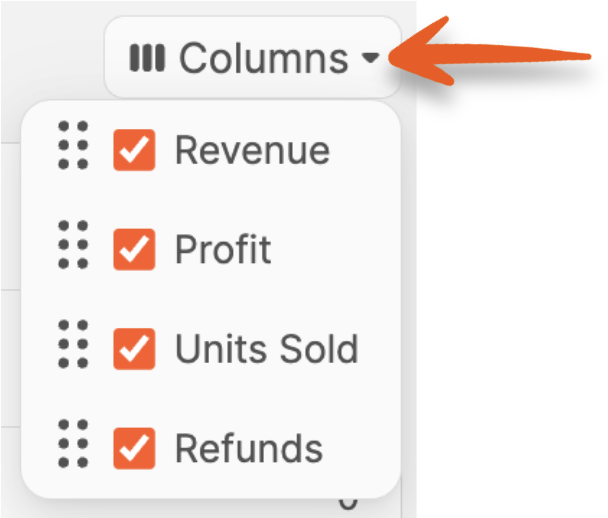
The available columns are:
- Revenue
- Profit
- Units Sold
- Refunds
If you want to change the order of the columns chosen, click and drag the option up or down to the desired position.
All columns are sortable by clicking the arrows next to them.
Clicking on a category will show various chart breakdowns, such as daily revenue, fee, refund, total profit, and a list of the products sold. For more info on the data shown, please check this article's View Details portion.