Dashboard
Imagine the Dashboard as your Amazon control center. It gives you a big-picture view of your business, allowing you to keep track of everything at a glance.
To navigate to this page, click Dashboard on the left menu.

At the top, you'll see sales figures for Today, This week, Month to date, and Last month.

Clicking the pencil icon next to a date range allows you to change it.

To see detailed information, click the arrow.
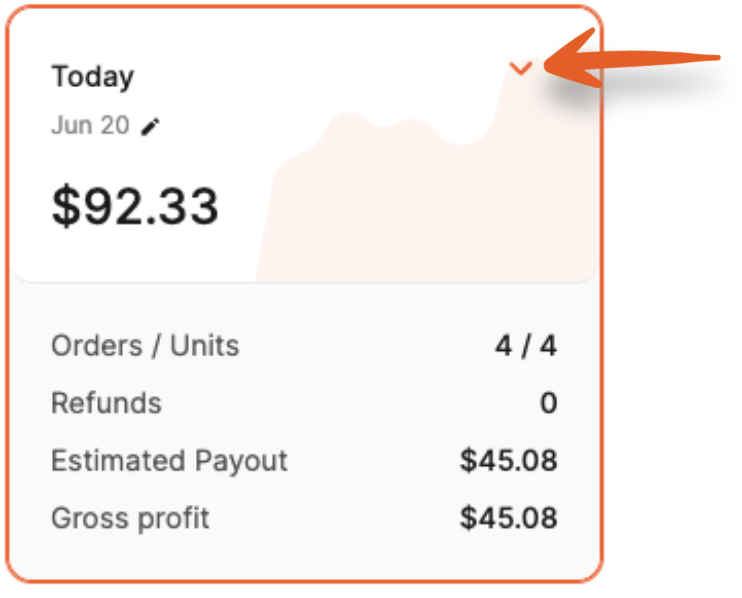
The window will expand to show a breakdown of the sales and fees used to calculate profit and estimated payout for the timeframe. Clicking the arrows next to Sales and Amazon Fees will break them down further.
Under the profit, more figures are displayed, including % Refunds, Margin, and ROI.

Beneath the sales figures are options to see Sales over time or Products sold.
Sales over time
The graph below shows Sales over time based on the timeframe being viewed.
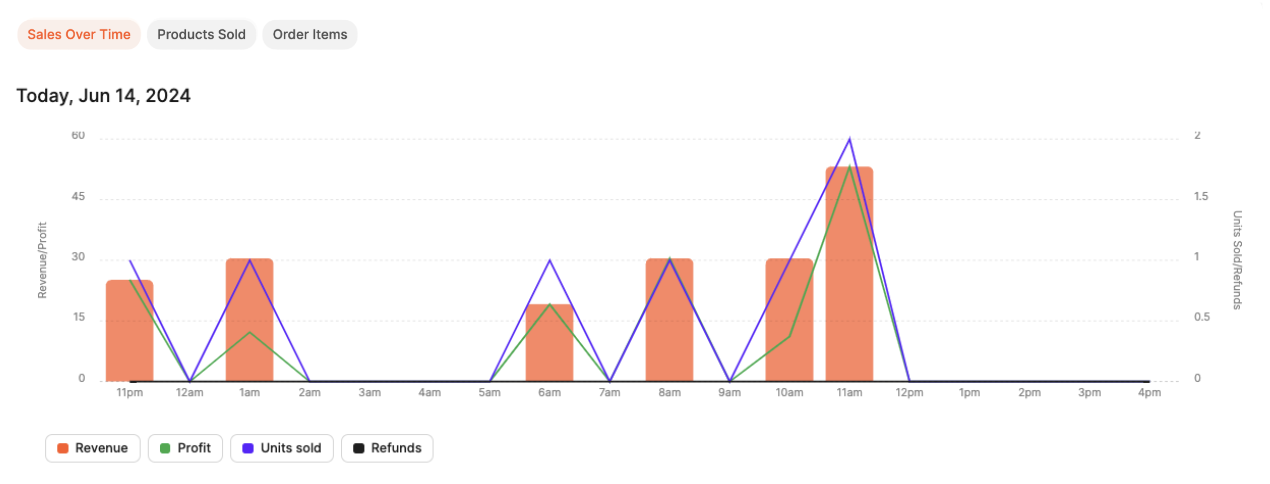
Hover over the graph points to see Revenue, Profit, Units sold, and Refunds.

Products sold
The list shows products sold based on the timeframe being viewed.
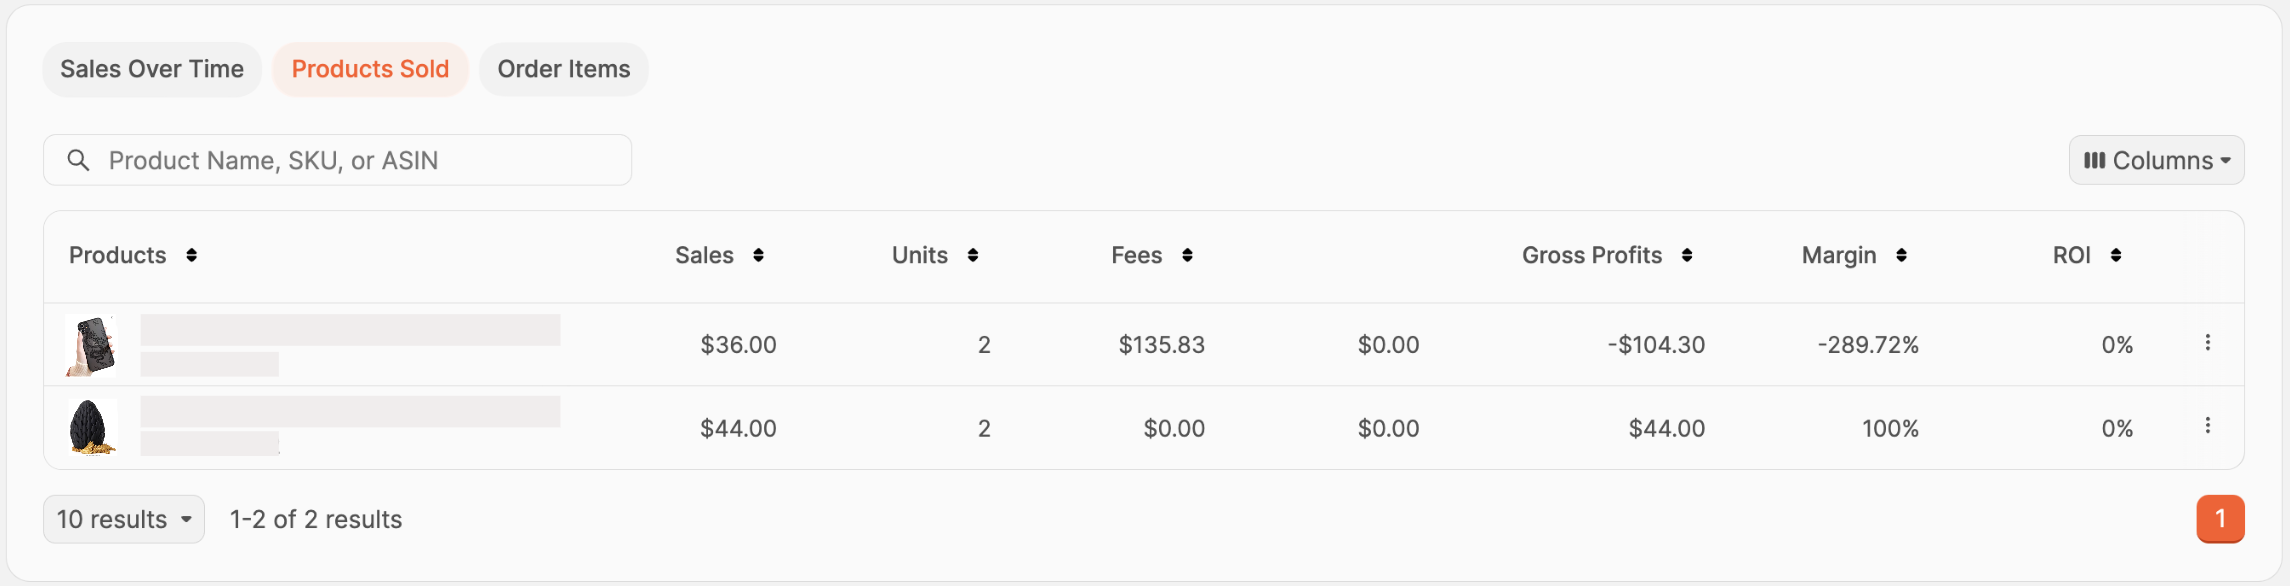
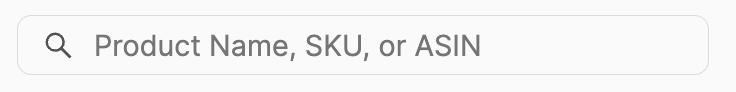
You can use the search bar to find products by name, SKU, or ASIN.
Choose the data shown by clicking the Columns button, then click the checkboxes next to the columns you'd like to see.
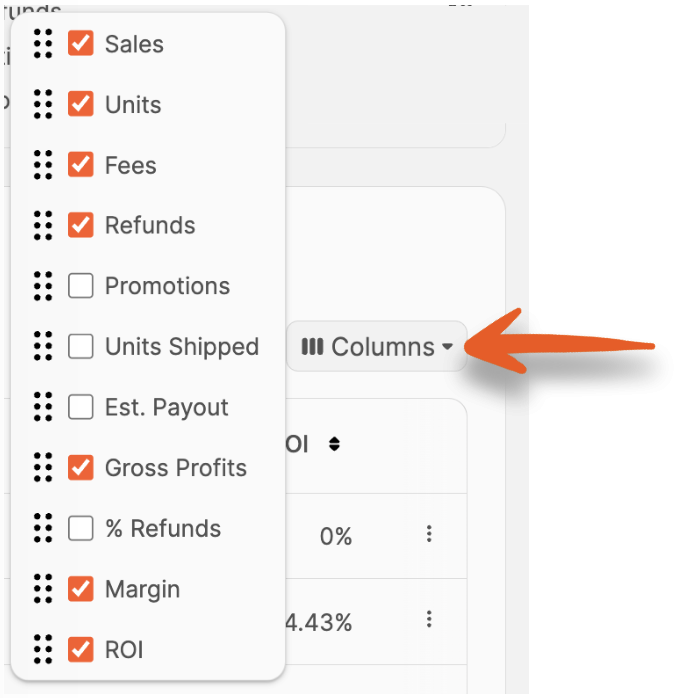
The available columns are:
- Sales
- Units
- Fees
- Refunds
- Promotions
- Units Shipped
- Est. Payout
- Gross Profits
- % Refunds
- Margin
- ROI
If you want to change the order of the columns chosen, click and drag the option up or down to the desired position.

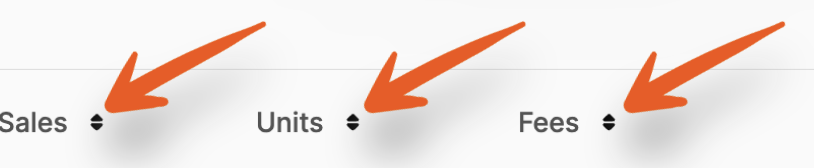
All columns are sortable by clicking the arrows next to them.
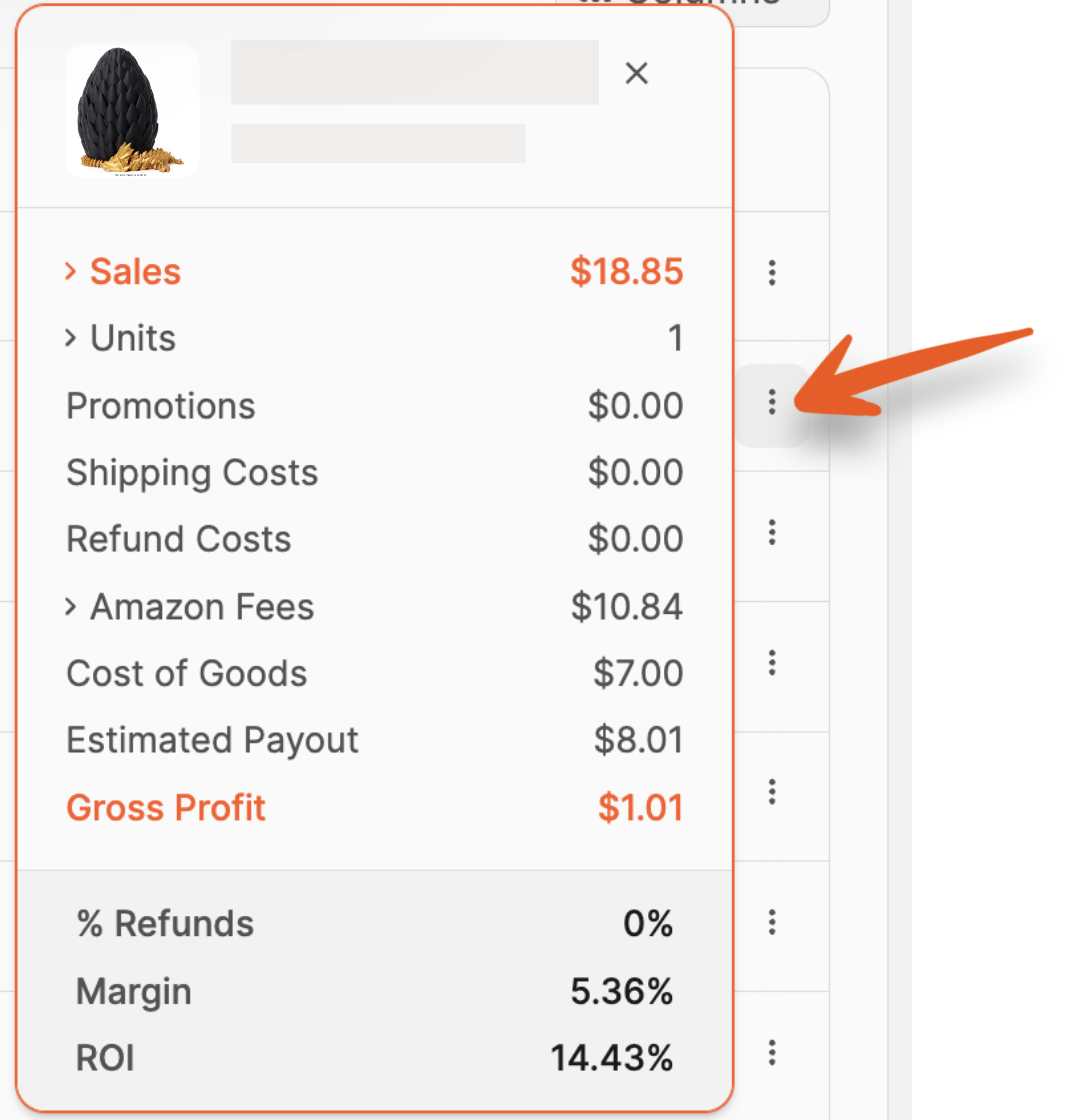
To see a breakdown of the profit for an item, click the three vertical dots next to it in the list. A window will open displaying the sales and related fees.
Order Items
The list shows orders based on the timeframe being viewed.
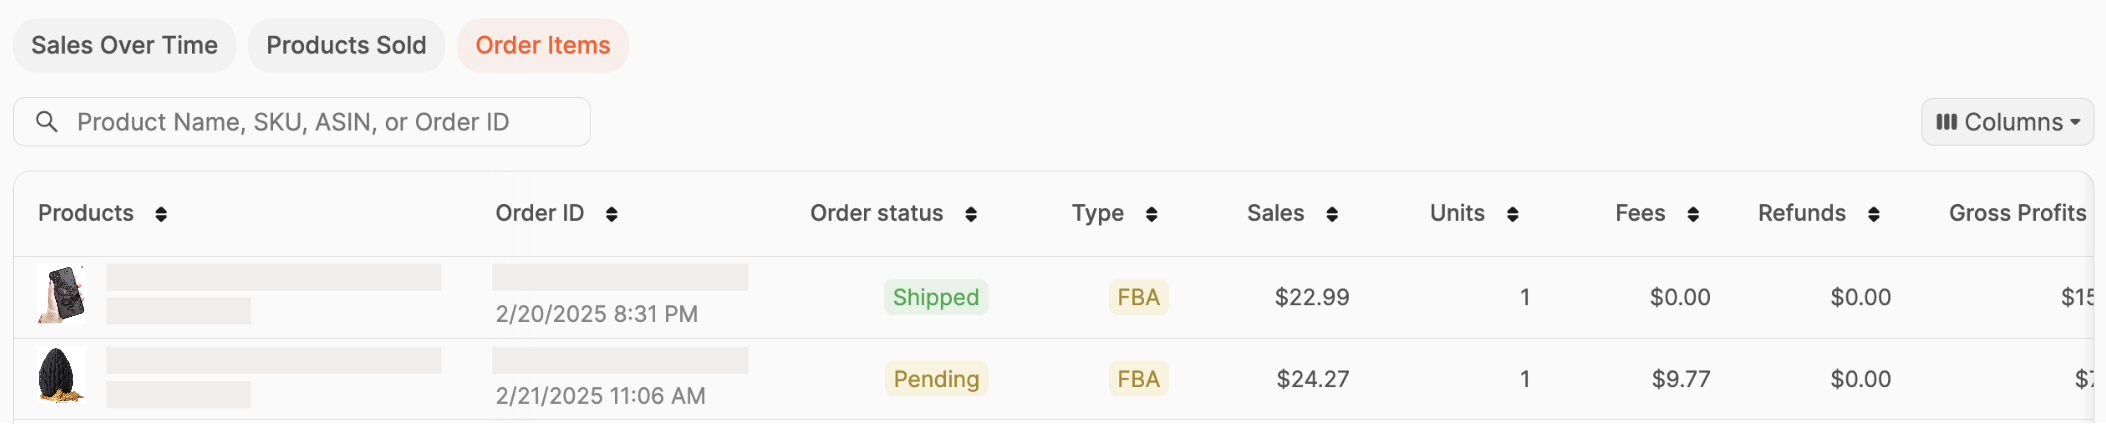
You can use the search bar to find products by name, SKU, ASIN, or Order ID.

Choose the data shown by clicking the Columns button, then click the checkboxes next to the columns you'd like to see.

The available columns are:
- Order Status
- Type
- Sales
- Units
- Fees
- Refunds
- Promotions
- Units Shipped
- Est. Payout
- Gross Profits
- % Refunds
- Margin
- ROI
If you want to change the order of the columns chosen, click and drag the option up or down to the desired position.
All columns are sortable by clicking the arrows next to them.
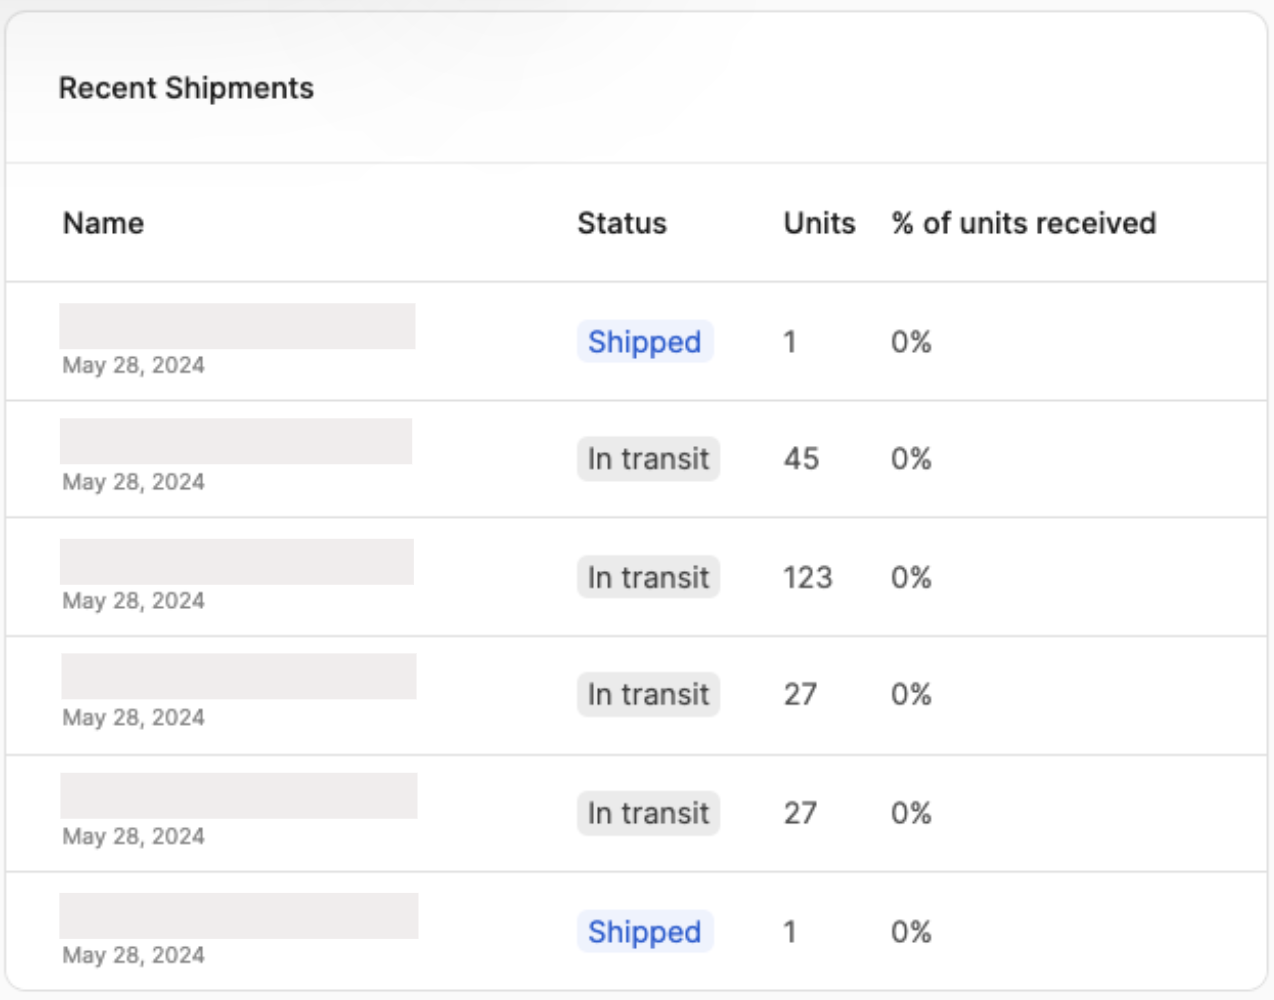
Recent Shipments
Recent Shipments are displayed at the bottom of the page for easy tracking. You can view the following information at a glance:
- Shipment Name (and date)
- Status
- Units
- % of units received